Errata (1st edition)
Check this page for corrections to Personality Psychology: Foundations and Findings (Pearson, 2012). If you find something which you feel needs to be corrected, please leave a comment below.
Chapter 4: Personality Assessment
There is a point of confusion on p. 82 of Chapter 4: Personality Assessment. Click here for a screen shot to see how the text should read. Convergent validity (and discriminant validity for that matter) can be thought of as specific kinds of criterion validity. However, I think it may be easier for students to think of them as different kinds of validity, and so I’ve re-worded the definition of criterion validity on p. 82 to make the difference between criterion validity and convergent validity clearer.
There are also two typos in the text on p. 84 of Chapter 4: Personality Assessment. Click here for a screen shot to see how the text should read. Predictive validity (not discussed in the text) is a specific type of criterion validity in which a test predicts to some outcome (criteria) in the future. Construct validity is the most general type of validity. While it is true that Barnum statements do lack construct validity, specifically the kind of validity which is lacking is criterion validity because Barnum statements do not distinguish between people; i.e. they are so general that they apply to nearly everybody.
Chapter 5: Self and Identity
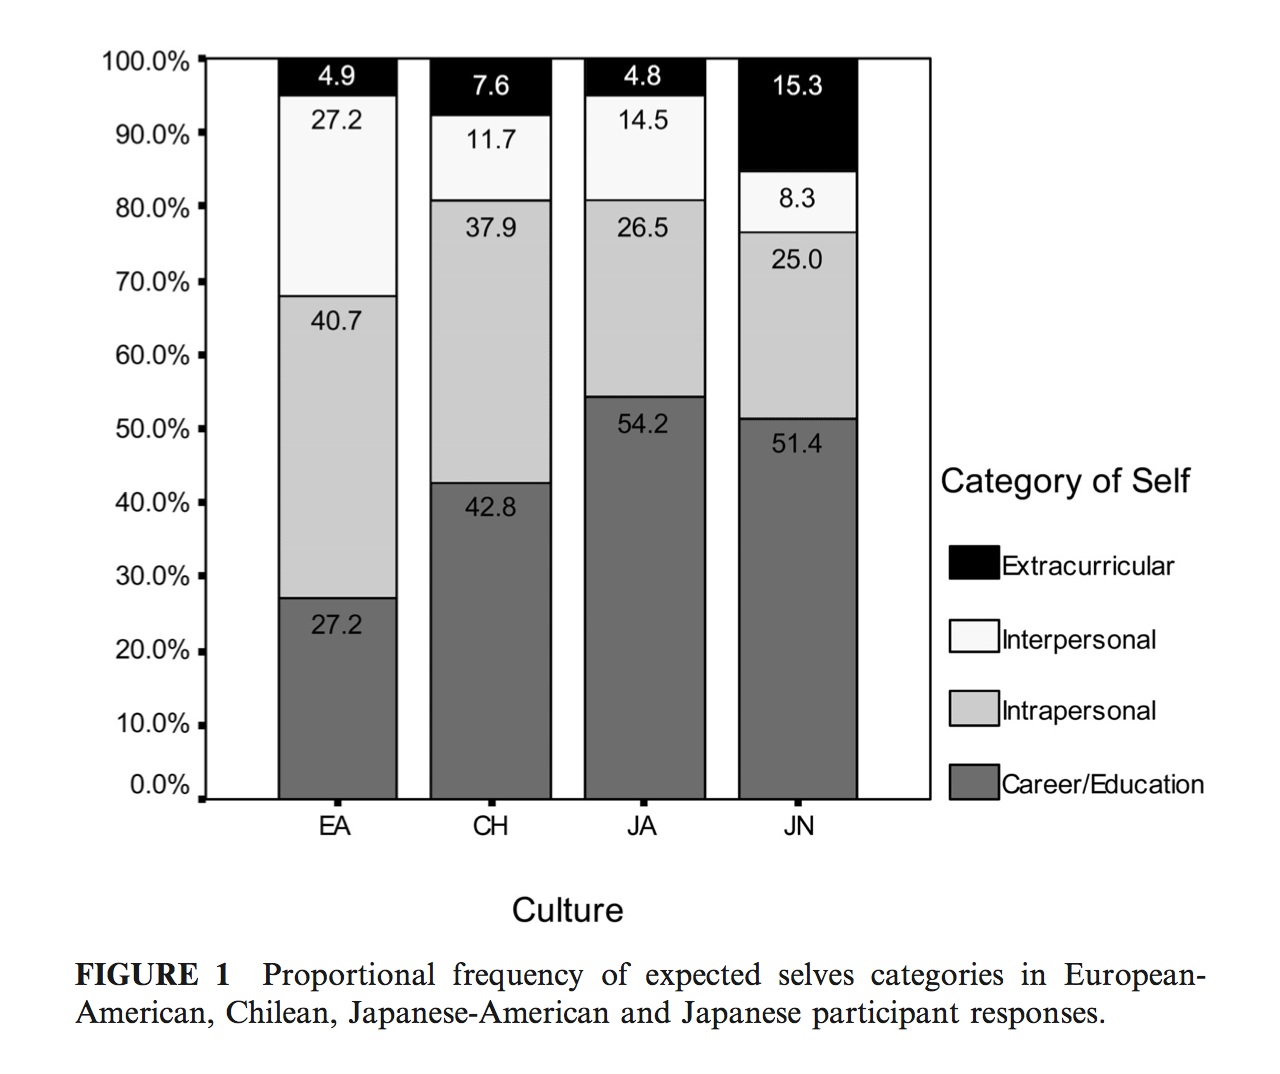
There is a problem with the key for Figure 5.4 of expected selves on p. 132 of Chapter 5: Self and Identity. The brownish color represents “Intrapersonal” and the orangy color represents “Career/Education”. You can see the original graph from Unemori et al., (2004) here.
Similarly, there is a problem with the key for Figure 5.5 of feared selves on p. 133 of Chapter 5: Self and Identity. The brownish color represents “Intrapersonal” and the orangy color represents “Career/Education”. You can see the original graph from Unemori et al., (2004) here.
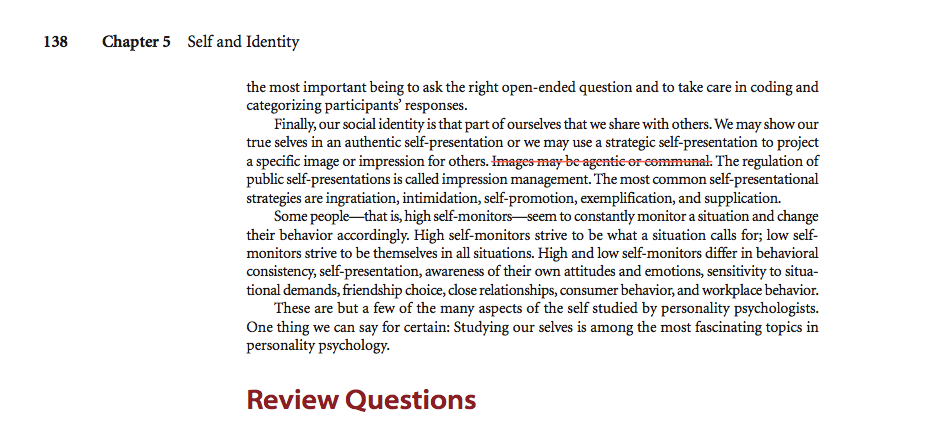
Also, on p. 138 of Chapter 5: Self and Identity. The sentence in the Chapter Summary which reads “Images may be agentic or communal” should be deleted. Click here for a screen shot to see how the text should read.
Chapter 6: Genetics
There is a possible source of confusion. On p. 140, the very opening of Chapter 6: Genetics, the first sentence refers to the Shakespeare quote which appears in the margin to the left.
Chapter 7: The Neuroscience of Personality
The color of the squares (males) and circles (females) in the scatterplots of Figure 7.1 on p. 174 of Chapter 7: The Neuroscience of Personality were reversed from the original graphic from Wright et al (2006) in the final printing. This may cause some confusion in the last sentence of the third paragraph of that page which matches the original graphic, not the graphic as printed. To match the scatterplot as it appears, the last two sentences should read “Each point represents a participant in the study. In this graph, the red circles represent females and the blue squares represent males (ignore for a moment the diagonal lines drawn through the dots).”
p. 190, Figure 7.6. The original graphic shows the underlying neural circuits clearer than the stylized version as printed. Click here to see original graphic from Whittle et al. (2006).
Chapter 8: Intrapsychic Foundations of Personality
p. 210, Figure 8.2, Reaction times for the word association test (Jung, 1910). The colors may look a bit different depending on your book. What the legend calls blue is actually the purple bars in the image. See Jung’s original graphic here.
p. 221, Table 8.1, Summary of Freud’s Psychosexual Stages of Development, is by the author for this textbook. The reference listed (Bornstein, 2005, Table 1) is incorrect.
Chapter 10: Cognitive Foundations of Personality
p. 275, Table 10.1 Items From the Rotter Internal-External Locus of Control Scale. As described in the second-to-last paragraph on p. 274, respondents are presented with 29 pairs of statements and much choose which item they agree with more. Six of the pairs are filler items and are not scored. Respondents get 1 point for each External item they choose. Therefore scores can range from 0 to 23, with higher numbers indicating a more External Locus of Control. The note beneath the table is incorrect when it states “Based on a scale of 0 = no chance to 100 = certainty“.
A word about the slides . . .
Please note that I did not create the slides. I have noticed a few inconsistencies between the slides and the textbook. Luckily, users can modify the slides themselves and even add their own material.